

Money Guide
Money Guide
S&P 500 P/E ratios and returns. Also: Indicators, Weekly Agenda, News, Musings, Opportunities
In this issue: an optimistic rally, lower inflation, US debt-ceiling threats, Private Equity valuation tricks, a foggy Crypto scene, WEF diminishing relevance, and a few thoughts on S&P 500 P/E ratios and returns
Indicators
Previous update: January 8th, 2022
mid-term forecast* | past-week performance
🟢=positive 🔴=negative ⚪=neutral
▲=increase ▼=decrease ─=no change
Click here for an in-depth look at how to read the Money Guide Indicators
🔒|🟢▼ US Inflation: 6.50% (vs 7.10% 11/22)
🔒|🔴▲ US Funds Rate: 4.50% (vs 4.00% 10/22)
🔒|🟢▼ US 02Y T-Note: 4.17% (vs 4.22%)
🔒|🟢▼ US 10Y T-Note: 3.49% (vs 3.56%)
🔒|🟢▼ DXY index: 102.18 (-1.7% vs 103.91)
🔒|🟢▲ EURUSD: 1.08 (+1.9% vs 1.06)
🔒|🟢▼ EU Inflation: 9.20% (vs 10.10% 11/22)
🔒|🔴▲ EU Funds Rate: 2.00% (vs 1.50% 10/22)
🔒|🟢▼ USDMXN: 18.75 (-2.0% vs 19.13)
🔒|🟢▲ MX Inflation: 7.82% (vs 7.80% 11/22)
🔒|🔴▲ MX Funds Rate:10.50%(vs10.00% 10/22)
🔒|🔴▲ MX 1Y Cetes: 11.06% (vs 11.00%)
🔒|🟢▲ DJIA: 34334 (+2.0% vs 33664)
🔒|🟢▲ S&P500: 3999 (+2.7% vs 3893)
🔒|🟢▲ NDQ100: 11549 (+3.7% vs 11133)
🔒|🟢▲ RUT: 1892 (+5.0% vs 1801)
🔒|🔴▲ GSCI: 605.79 (+5.7% vs 573.16)
🔒|🔴▲ Brent Oil: 87.24 (+4.1% vs 83.84)
🔒|🔴▲ Gold: 1920 (+2.9% vs 1866)
🔒|🟢▲ BTC: 20879 (+21.9% vs 17125)
🔒|🟢▲ ETH: 1552 (+20.4% vs 1289)
🔒|🟢 Overall
**** ***** ******* ******* ********** ** *** *** ******. *** ** ****** **** ***** *** ********** **** ** ***********.
** *** * ************ ** *** ******** **** ********** ******* ** *********** ******* **** ****** **** ******** **** *** **** **** **** ************ ******** *** ** *** ********.
********* ** ******** *** **’* ***** ** * **** **** ****** *** ****** ******** ******* ***** **** ***** ** * ******* *******.
* ******* * *******-***** ********* ** ****** ****** ***** **** **** ***** ** ********* ** *** ** ***** *********.
** *** ***** ** * **** ******.🔒
*These forecasts are available only in the premium edition of Money Guide for paid-subscribers. To be better informed, you need more than just past performance indicators
Weekly Agenda
Monday: US Markets closed, CN GDP report
Tuesday: ⚠️JP Interest Rate decision
Wednesday: ⚠️GB/EU Consumer Price Index (CPI) report, ⚠️US Producer Price Index (PPI) report
Thursday: ⚠️JP Inflation report
Friday:
Q4 Earnings reports during the week
⚠️Probable high volatility when information is released to the public
(Click here to read about the usual market behaviour)
News
📰 🟢 December CPI: Inflation rises 6.5% over last year | The Consumer Price Index (CPI) for December showed a 6.5% rise in prices over last year and a 0.1% decrease over the prior month (link)
📰 🔴 Yellen says US is projected to hit Debt Ceiling on January 19 | Yellen shared the estimate in a letter to Speaker Kevin McCarthy (R-Calif.) on Friday. She also warned the department would soon have to begin taking “extraordinary measures” to stave off a default to buy time for Congress to find a bipartisan solution (link)
📰 🔴 LME data-entry error showed Copper down 77% in latest glitch | The error came at the close of trading in the LME’s second open-outcry pricing session, which sets the global benchmark price for the physical metals industry. The mistake was a result of a data-entry error (link)
📰 🟢 Iran and Russia want to issue new Stablecoin backed by gold | The stablecoin aims to enable cross-border transactions instead of fiat currencies like the United States dollar, the Russian ruble or the Iranian rial (link)
📰 🟢 Binance to let institutions store crypto with cold custody | The Mirror service is based on Binance Custody and involves mirroring cold-storage assets through 1:1 collateral held on a Binance account (link)
📰 🔴 SEC charges Gemini and Genesis with unregistered securities offering | This comes amidst a public fight between the leadership of the two companies, which already ended their partnership on the program under scrutiny (link)
Musings
💭 🔴 Why does Private Equity get to play make-believe with prices? | Investors and managers are playing a dangerous game of “volatility laundering,” Cliff Asness writes (link)
💭 🔴 Deep-Learning expert says GPT startups may be in for a very rude awakening | Despite the VC gold rush, this expert is arguing that hype -as opposed to firm data and proven results- is in the generative AI industry driving seat (link)
💭 🔴 Davos draws record crowds, but its relevance is fading | For decades, business leaders, billionaires and politicians have gathered in Davos, Switzerland under the banner of forging ties that can help solve global problems (link)
💭 🔴 Crypto is shocking to a financial historian who literally wrote the book on financial bubbles | Quinn believes the cryptocurrency fervor of the past decade is either a “stupider bubble than any previous bubble” in financial history, or “a smarter Ponzi than any previous Ponzi”-or a third option. “So we have two possibilities,” he wrote in an article on journalist David Gerard’s website last week. “And the truth is probably somewhere in the middle” (link)


Opportunities
💡 2023 Stocks to Watch | Bloomberg Intelligence tracks some 2,000 companies in sectors ranging from communications and commodities to finance and food. BI has identified 50 that warrant a closer look this year based on a list of Focus Ideas, which combine contrarian views and upcoming catalysts for change (link)
💡 Sweden finds the largest rare earth deposit in Europe | Swedish mining company LKAB says it has found Europe's largest deposit of rare earth oxides in the country's north, a discovery that could reduce the continent's reliance on China for the critical resource. (link)
💡 DeFi Protocol Ondo Finance Sets Up Tokenized Corporate Bonds With Over 8% Yield on Stablecoins | The on-chain funds are directly invested in exchange-traded funds managed by BlackRock and Pimco (link)
A few thoughts on…
S&P 500 P/E ratios and returns
This week I’m following-up on the topics I’ve been exploring from different angles during the beginning of this year.
The previous pieces can be read in full here:
S&P 500 prices and probabilities
S&P 500 earnings and multiples
Even if we understand the concept of the Price-to-Earnings ratio (P/E ratio) and the derived multiples, it’s important to visualize the impact of variations in the model.
Let’s start with a simple example: Company A has a steady $10 Earnings-per-Share (EPS) every year, without any kind of projected growth, assuming 0% interest rates and 0% inflation rates.
How much should investors be willing to pay for a share of Company A? An acceptable projected annual return for Equity in Company A might be 10%-12%?
Considering it is not a risk-free investment, and the investment is not guaranteed as it might be if Company A was raising capital through Corporate Bonds (debt).
A 10-year projection, using a 10x EPS multiple, could look like this:

Initial Stock Price: 10x EPS = 10x$10 = $100
EPS: 10% ($10) every year. $100 (+100%) accumulated during 10 years
Stock Price after 10 years: 10x EPS = 10x$10 = $100 (+0%)
Since Company A has steady EPS and doesn’t grow, every year Company A is worth the same. After 10 years, Investors can sell the purchased share for the same $100. Their net return would be $10 of EPS every year, that adds up to $100 after 10 years. That is a 12% compounded annual return.
Conceptually, earning $1 from Company A could be equal to earning $1 from any other company, so the pricing of shares shouldn’t change if there are no other significant differences between them. But some companies are projected to grow and increase their earnings. Historically, the average growth of S&P 500 companies has been 4.5%-8%. Discounting inflation we could consider 4% as a good reference value. The long-term average P/E Ratio for S&P 500 companies is close to 16x.
What kind of return on investment can be expected with 4% growth and 16x EPS?
A 10-year projection, using a 16x EPS multiple, could look like this:

Initial Stock Price: 16x EPS = 16x$10 = $160
EPS: $124 (+78%) accumulated during 10 years
Stock Price after 10 years: 16x EPS = 16x$14.80 = $236 (+48%)
The net return after 10 years would be $124 (+78%) of EPS and $76 (+48%) from the increase in price of the stock ($236 final stock price - $160 initial stock price). That is a 14% compounded annual return.
Since Company B has 4% annual EPS growth, every year Company B is worth more. It’s worth noting that by keeping a constant P/E ratio, EPS after 10 years are 48% higher and the stock price is also 48% higher. The value of the company increases in proportion to the increase of its earnings. Over a long-term horizon, this tends to occur in real-life markets with fluctuating EPS and multiples.
A 10-year projection, using a 20x EPS multiple and 6.5% growth, could look like this:

Initial Stock Price: 20x EPS = 20x$10 = $200
EPS: $143 (+72%) accumulated during 10 years
Stock Price after 10 years: 20x EPS = 20x$18.77 = $375 (+88%)
The net return after 10 years would be $143 (+72%) of EPS and $175 (+88%) from the increase in price of the stock ($375 final stock price - $200 initial stock price). That is almost a 14% compounded annual return.
Admittedly, a 14% annual return is better than a 12% annual return, but not by much. We could speculate that the higher expected return premium is a result of the increase in perceived risk that comes from the projected growth. At first glance, one might think that continuous growth will result in much higher returns, but that logic also increases demand for those stocks, and demand pushes up the initial stock price relative to current earnings, thus reducing the return on investment relative to that initial stock price. When investors pay higher EPS multiples in exchange for higher growth, their returns are diminished. In simple terms: high EPS multiples mean expensive stock prices.
But what about the S&P 500 Index?
Last week, I wrote:
If an investor had bought on December 31, 2012 at 1258, she would have received $1365 Earnings-per-Share during a 10-year period. That’s slightly better than the P/E Ratio for that year (11x earnings). At the time, she was buying with a projected return of $1258 ($112.17 EPS x 11.2 P/E multiple), and instead received around 8% more. In rough numbers, the math behind that 2012 pricing proved to be right.
It’s important to note that it doesn’t consider the price increase of the instrument itself, which almost quadrupled during that same time. In a strict sense, in the absence of speculation, the price would always be derived from the earnings, although it’s difficult to decide if past earnings are a better indicator than future earnings that could grow. During this decade, “growth” stocks (typically of Big Tech companies) have dominated the S&P 500 and that is one of the main reasons for the sharp increase towards the 4800 level.
That 10-year summary of the S&P 500 looks like this:

Initial Stock Price: 11x EPS = 114x$11 = $1257
EPS: $1365 (+108%) accumulated during 10 years
Stock Price after 10 years: 22.6x EPS = 22.6x$211 = $4766 (+279%)
The net return after 10 years would be $1365 (+108%) of EPS and $3509 (+279%) from the increase in price of the stock ($4766 final stock price - $1257 initial stock price). That is a 26% compounded annual return.
For investors that bought in 2012 at 11x EPS, the return on investment would have been much higher than expected, because stocks became more expensive even though earnings-per-share were in line with their initial projections. Investors buying in 2021 at 22x EPS or in 2022 at 20x EPS, the results might be different. What those investors should be asking themselves, is how likely it is for the EPS multiple to return to the mean, for the EPS to stay that high, or for the EPS to go even higher.
Last week’s post included this graph and this summary:
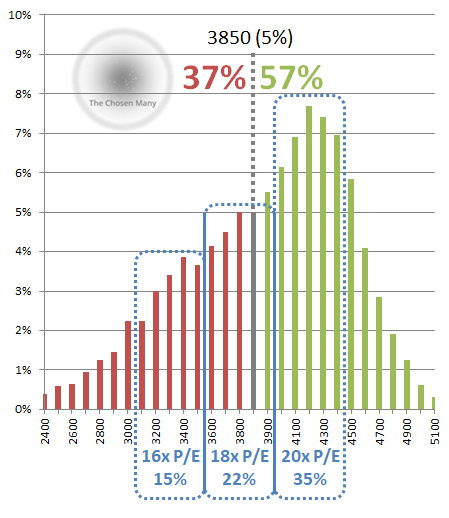
According to my calculations:
-The options market implied probability for the 3150-3550 range is around 14%, assigning over 70% probability to the upside and less than 15% to the downside.
That means 1-to-6 odds that Earnings-per-Share don’t change much from this year AND the market prices it at 16x earnings-The options market implied probability for the 3550-3950 range is around 22%.
That means 1-to-4.5 odds that Earnings-per-Share don’t change much from this year AND the market prices it at 18x earnings-The options market implied probability for the 3950-4450 range is around 35%.
That means 1-to-3 odds that Earnings-per-Share don’t change much from this year AND the market prices it at 20x earnings
(Click here to read the full piece)
A simple rule of thumb for investing is buying low and selling high. I believe that buying above 16x multiples is expensive, and even more so in the current global economic reality.
I think the 3150-3550 range can be the correct one by year-end, and the options market predominant optimism provides interesting trading and investing opportunities this year. However the course of the year plays out, this type of end-of-year broad-view scenarios are helpful to take advantage of the opportunities to come.


take care, have fun, be chill
-SM
There is more to life than money. Be in the know…
Enjoyed the content?
Subscribe to Money Guide to receive every new edition of The Chosen Many newsletters directly in your inbox, get instant access to all the archives and resources at our website, and join our private channel for additional up-to-date content.
Never miss an update and be a part of the conversation…
Spread the word